“Majority of U.S. public school students are in poverty”
That was the headline of a Washington Post article published almost exactly a year ago. The main point of the article was that, “For the first time in at least 50 years, a majority of U.S. public school students come from low-income families, according to a new analysis of 2013 federal data, a statistic that has profound implications for the nation.”
The claim is overblown and misleading (for reasons I explain here) but it’s in keeping with the most popular metric for measuring poverty in America: income. The problem with using income, as The Salvation Army explains, is that, “At best, income statistics provide only a hazy picture of the actual conditions facing the hungry, the homeless, the unemployed, and the underemployed.”
In collaboration with the Indiana University Lilly Family School of Philanthropy, the The Salvation Army developed the Human Needs Index (HNI) a “new, multidimensional way to measure poverty and its effects.” As they note in their new report,
Unlike other traditional measures of poverty, the HNI comprises indicators that represent need substantiated on consumption rather than income. Thus, the HNI’s greatest strength is that it illustrates a more intimate portrayal of need than any other index.
Another important contribution of the HNI is that it provides a reliable instrument for measuring human need in near real time, and for tracking trends in human need over time.
The advantage of this approach is that it provides critical observations informing the work of nonprofit organizations and public policymakers in reducing poverty.
The HNI analyzes seven indicator variables identifying the following kinds of assistance:
- Meals provided – served through a Salvation Army or other facility
- Groceries provided – food items provided by voucher or distributed through a food pantry or food bank
- Housing assistance – the number of rent or mortgage assistance payments to establish or maintain an individual or family in their own home
- Furniture provided – the number of furniture-order providers
- Medical assistance – assistance with prescription medicines and volunteers/hours served in medically related roles
- Energy assistance – assistance with energy bills and volunteers/hours served in energy-related roles
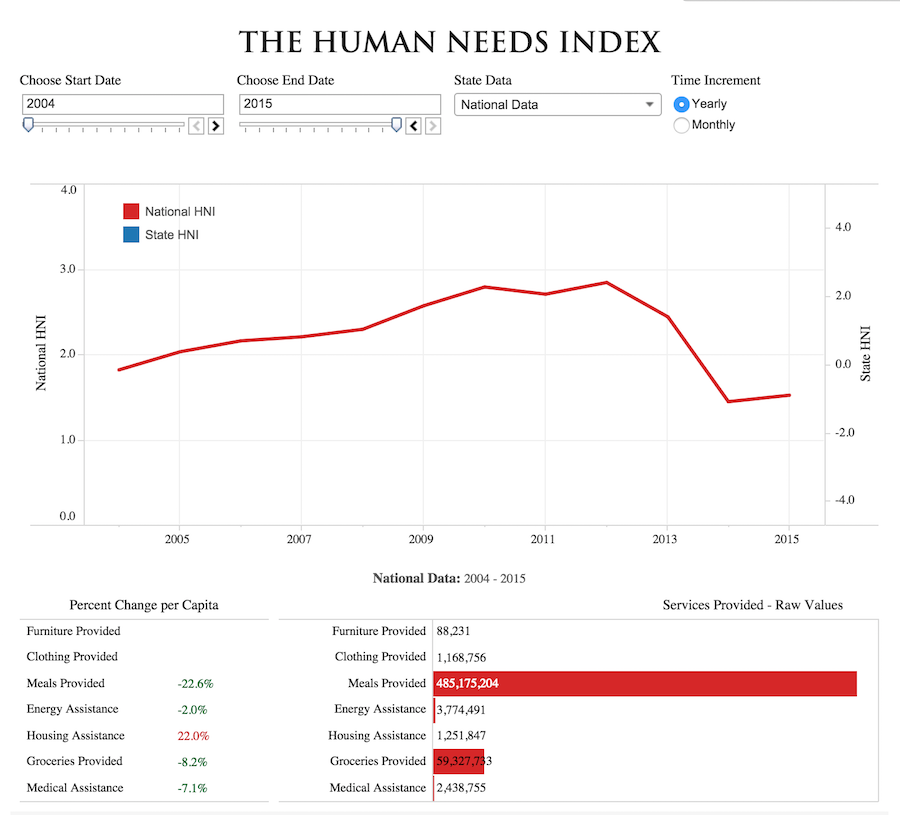
The seven variables are combined to produce a single HNI score with a scale that begins at 0 – indicating a minimum level of need. Here is the latest chart showing 2004 to 2015.

You can find the interactive state and national graph here and the full report on the HNI here.

